Data visualisation
Data visualisation
Apr 7, 2022

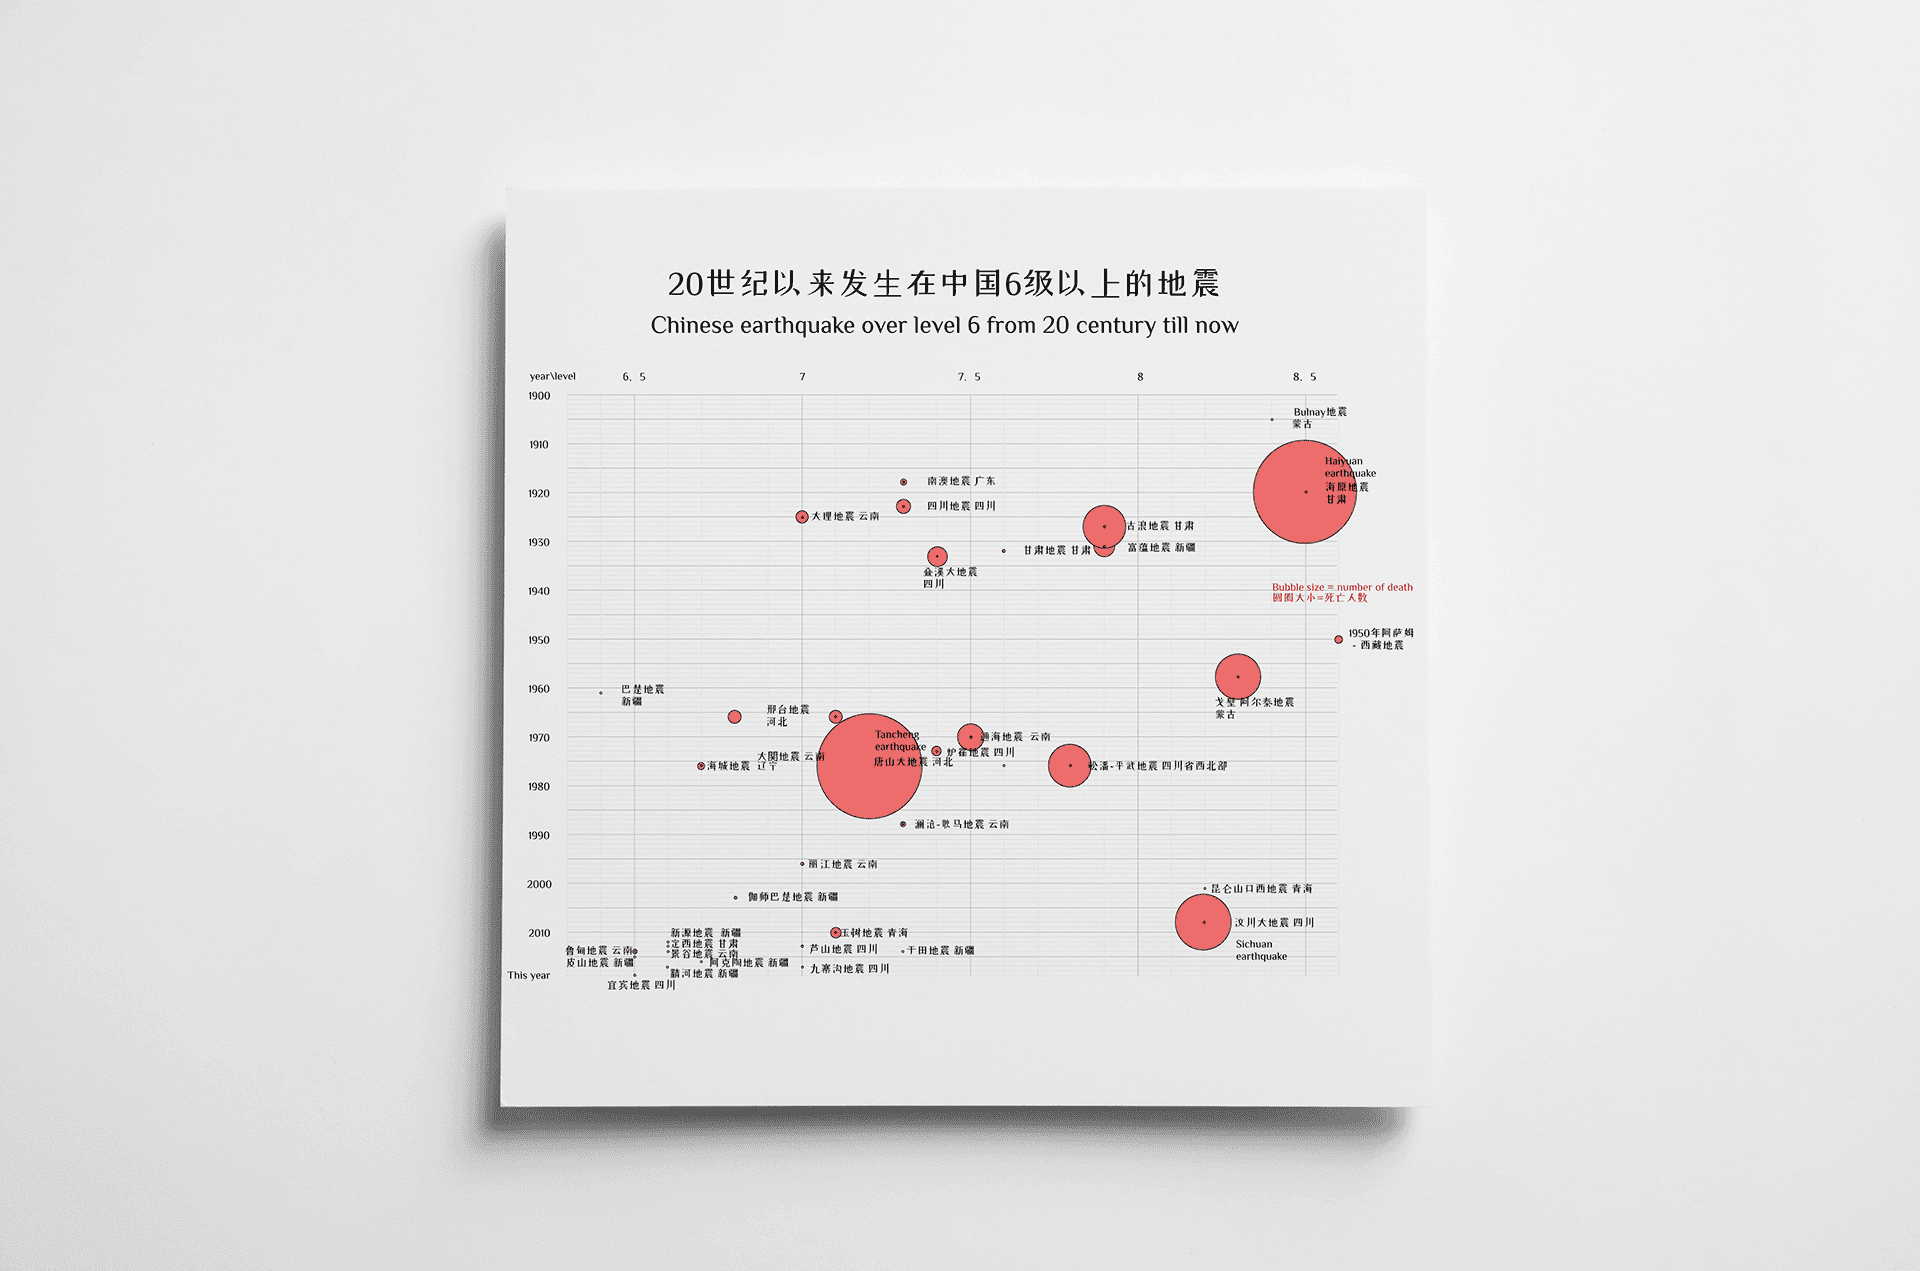
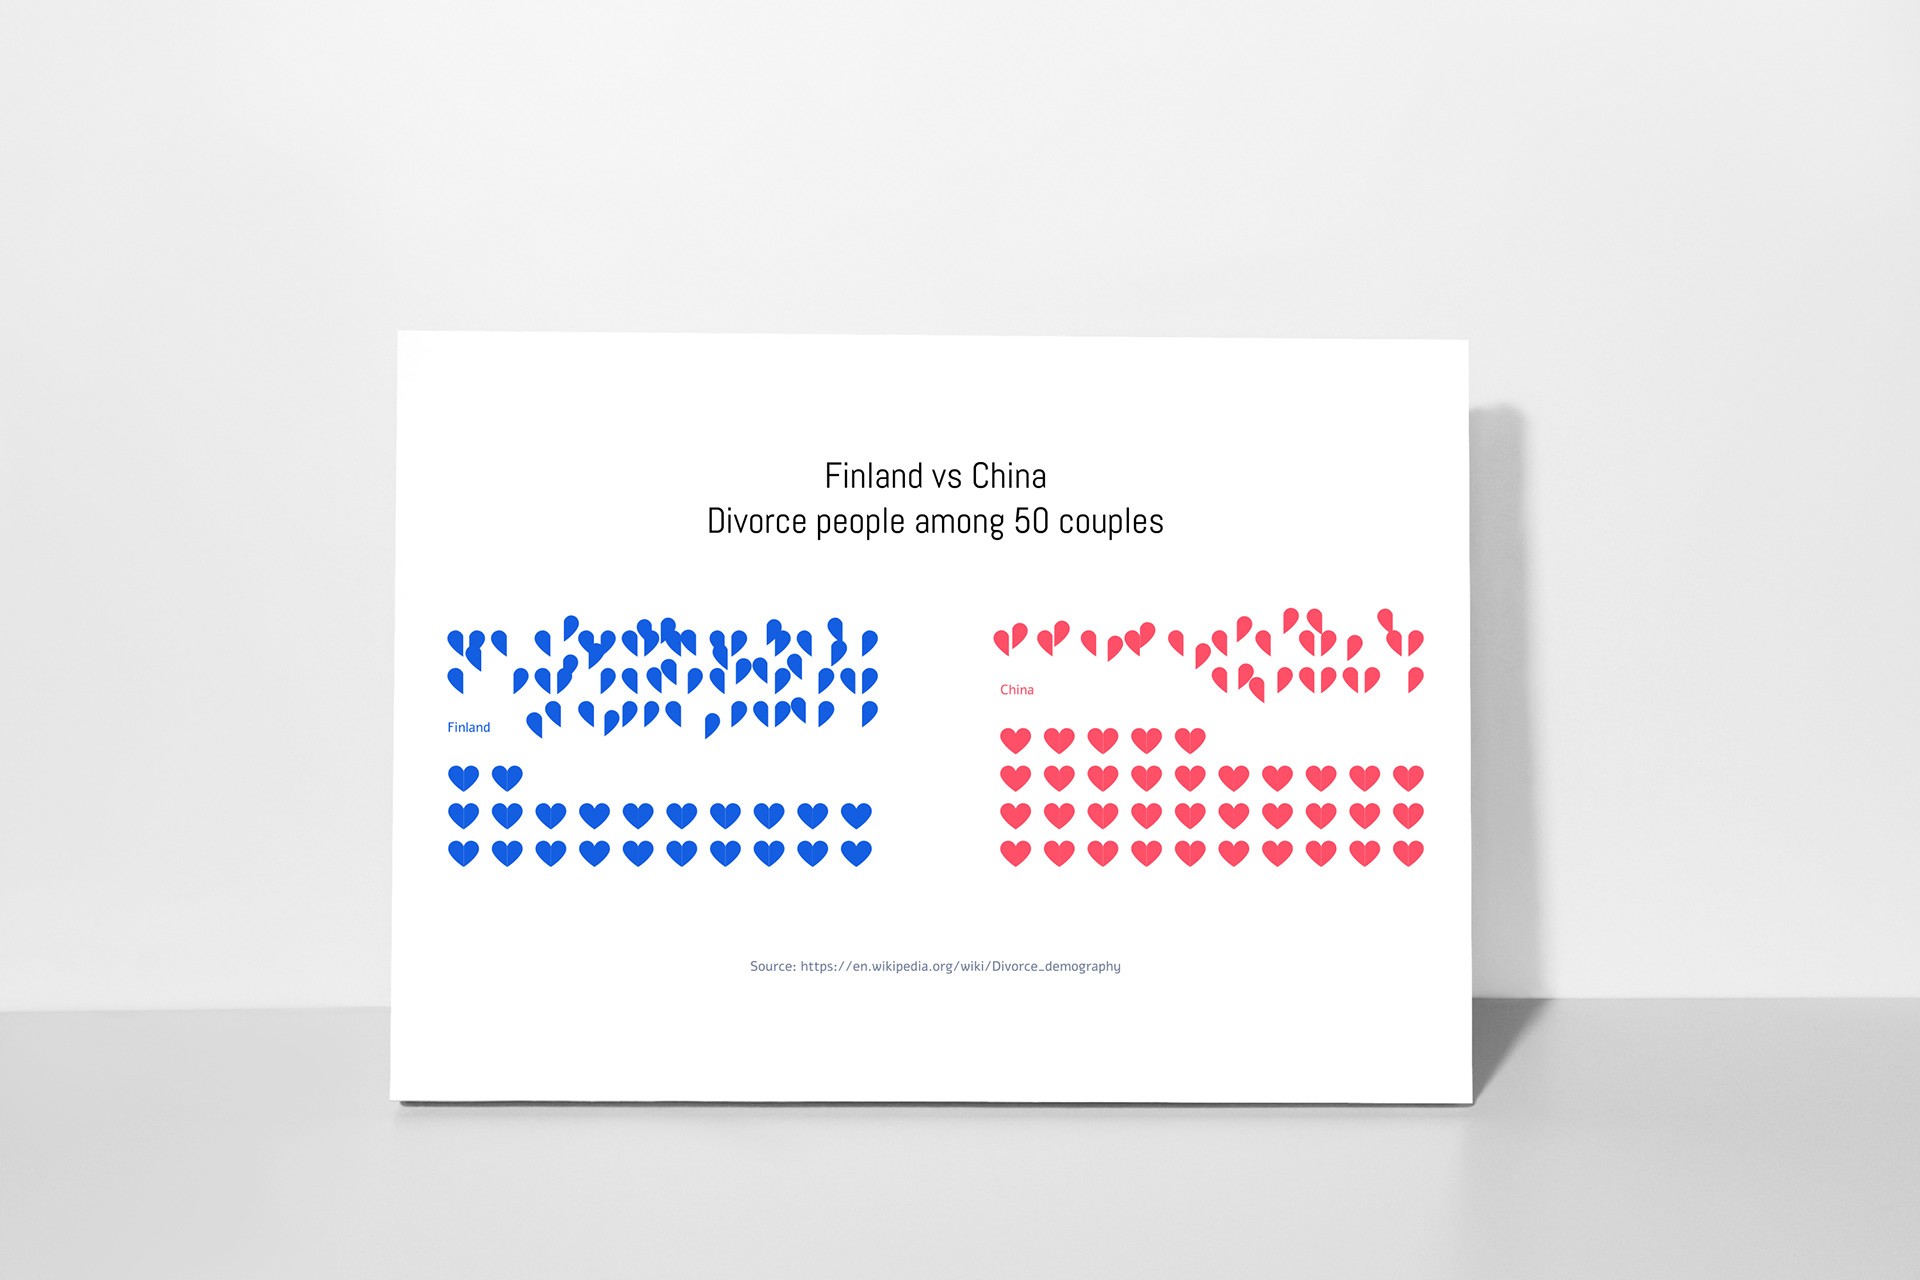
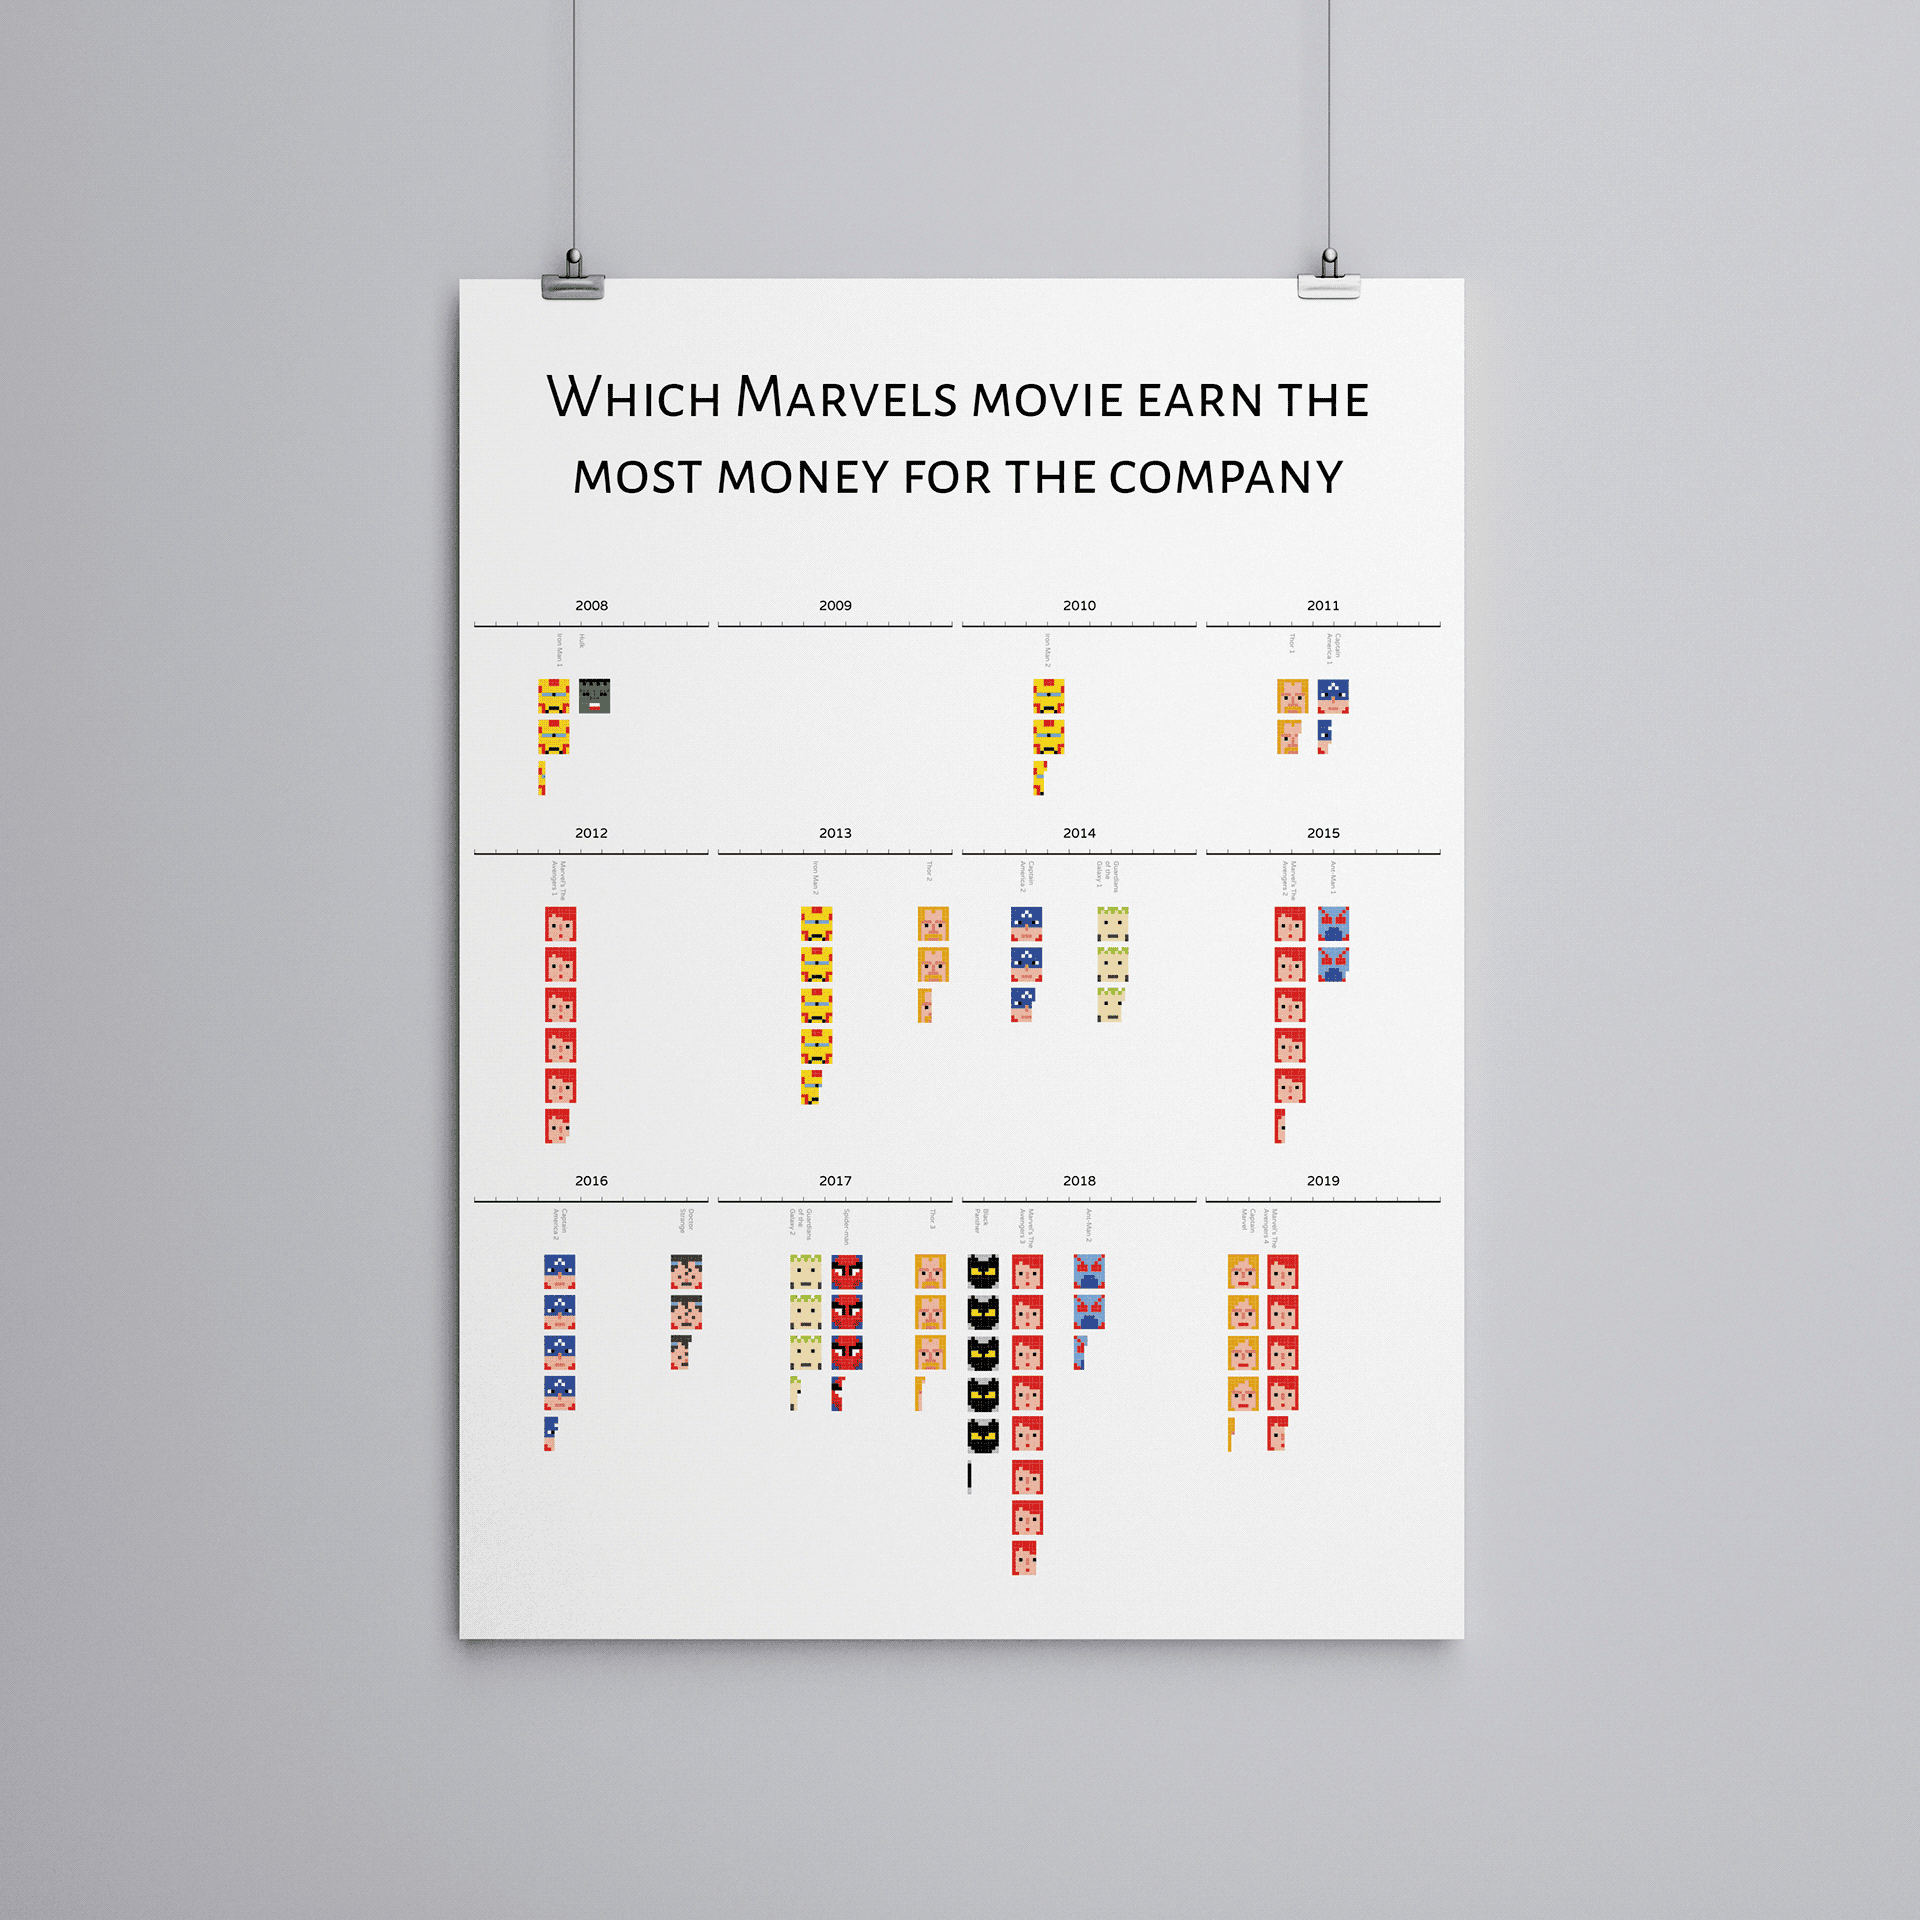
At the beginning of 2019, I got interested in DataViz. I started creating DataViz in my spare time. The design is related to my personal experience or some news' data. I wish that by practising DataViz, I can make data to tell a story.


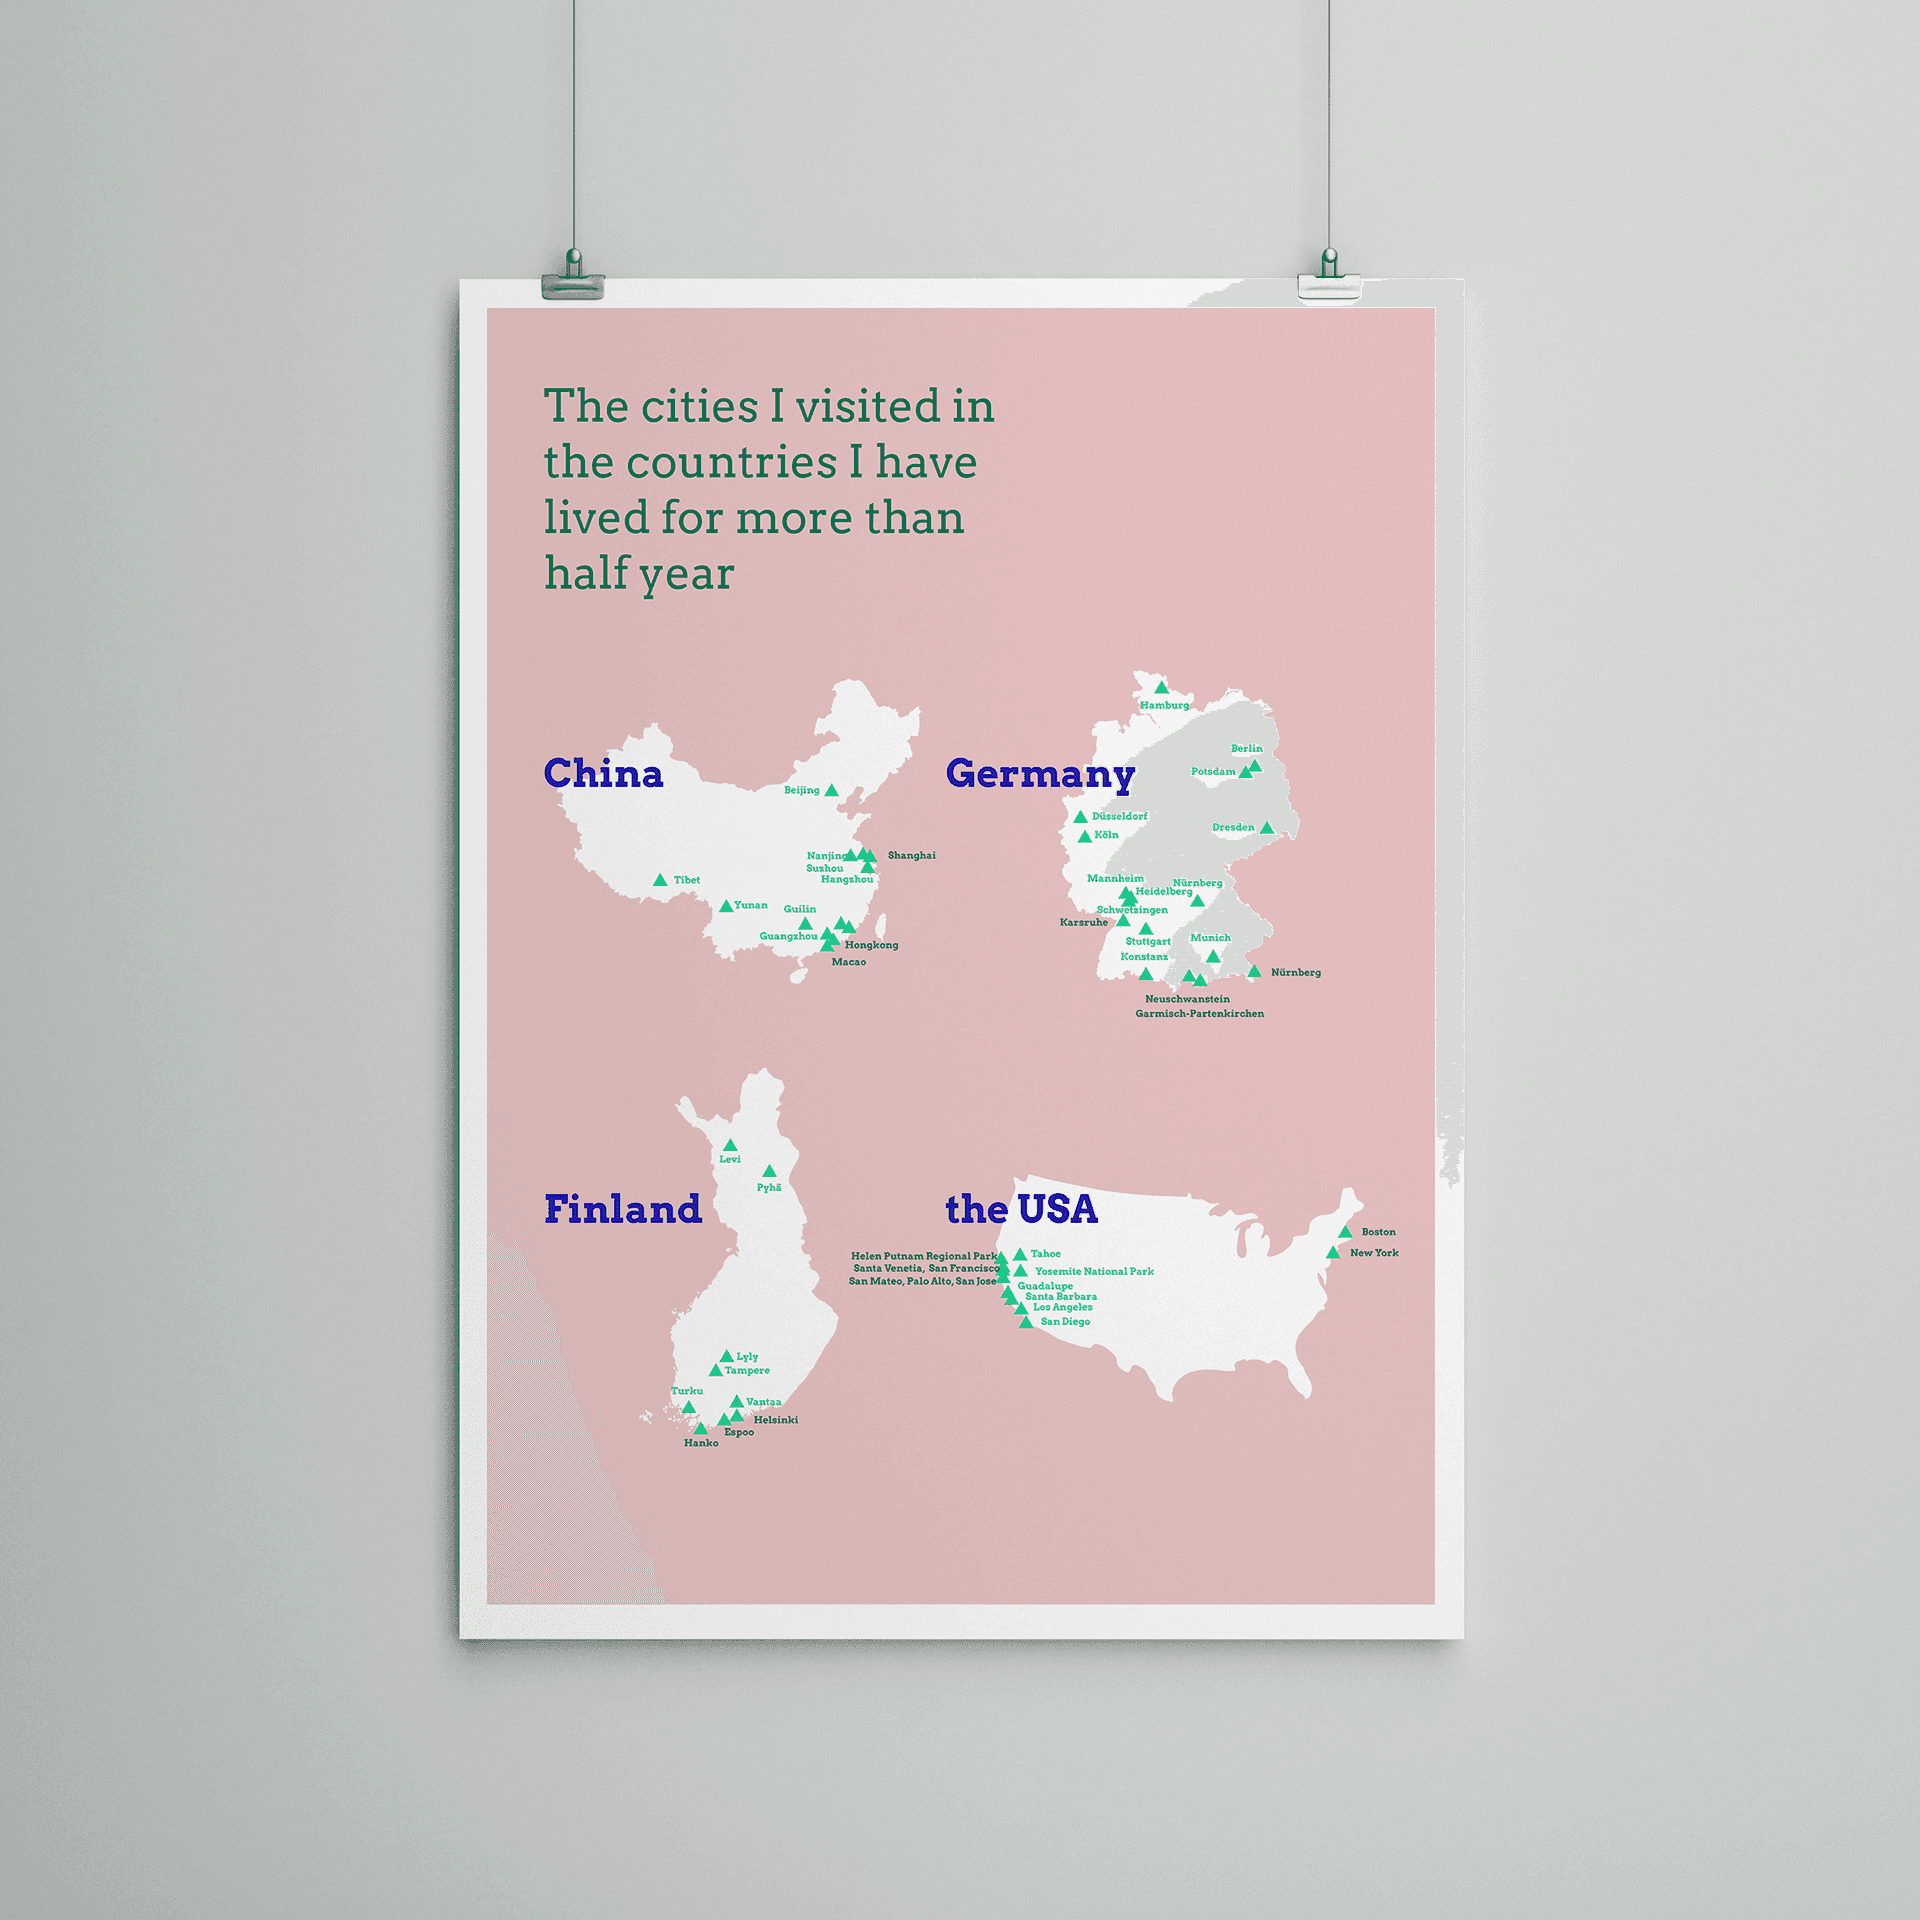

The last graphic was previously created in 2019. After 3 years of epidemic, I am curious to see how much less travel I have done during the time. What I find out is that I travel more inside Finland. Besides, it has been 2 and half years since last time I visited China. Now the situation gets better, hopefully I can travel more again : -)


